Power BI dashboards
Interactive dashboards to track sales, finance, operations and business KPIs in one place.
I help businesses turn financial and operational data into clear dashboards, useful insights and better decisions.
Finance experience meets data analytics
5 years in accounting and financial operations
Illustrative interface graphic · not client financial data
I’m Kishlay, a finance professional moving deeper into business intelligence and data analytics. I bring five years of experience in accounting and financial operations, along with an MBA in Financial Management.
My background helps me understand what sits behind the numbers — revenue, costs, cash flow, receivables, reporting and business performance. I use Power BI, Advanced Excel and Power Query to turn that information into reports people can actually use.
Practical reporting and analytics support for teams that want a clearer view of their business.
Interactive dashboards to track sales, finance, operations and business KPIs in one place.
Cleaner reporting processes, reusable templates and automated monthly MIS using Excel and Power Query.
Support with P&L reporting, budget vs actual, expense analysis, cash flow and management reporting.
Transform raw spreadsheets into structured data and highlight trends, exceptions and useful findings.
Portfolio projects built to demonstrate dashboard design, KPI reporting and business thinking. Sample data is used where stated.
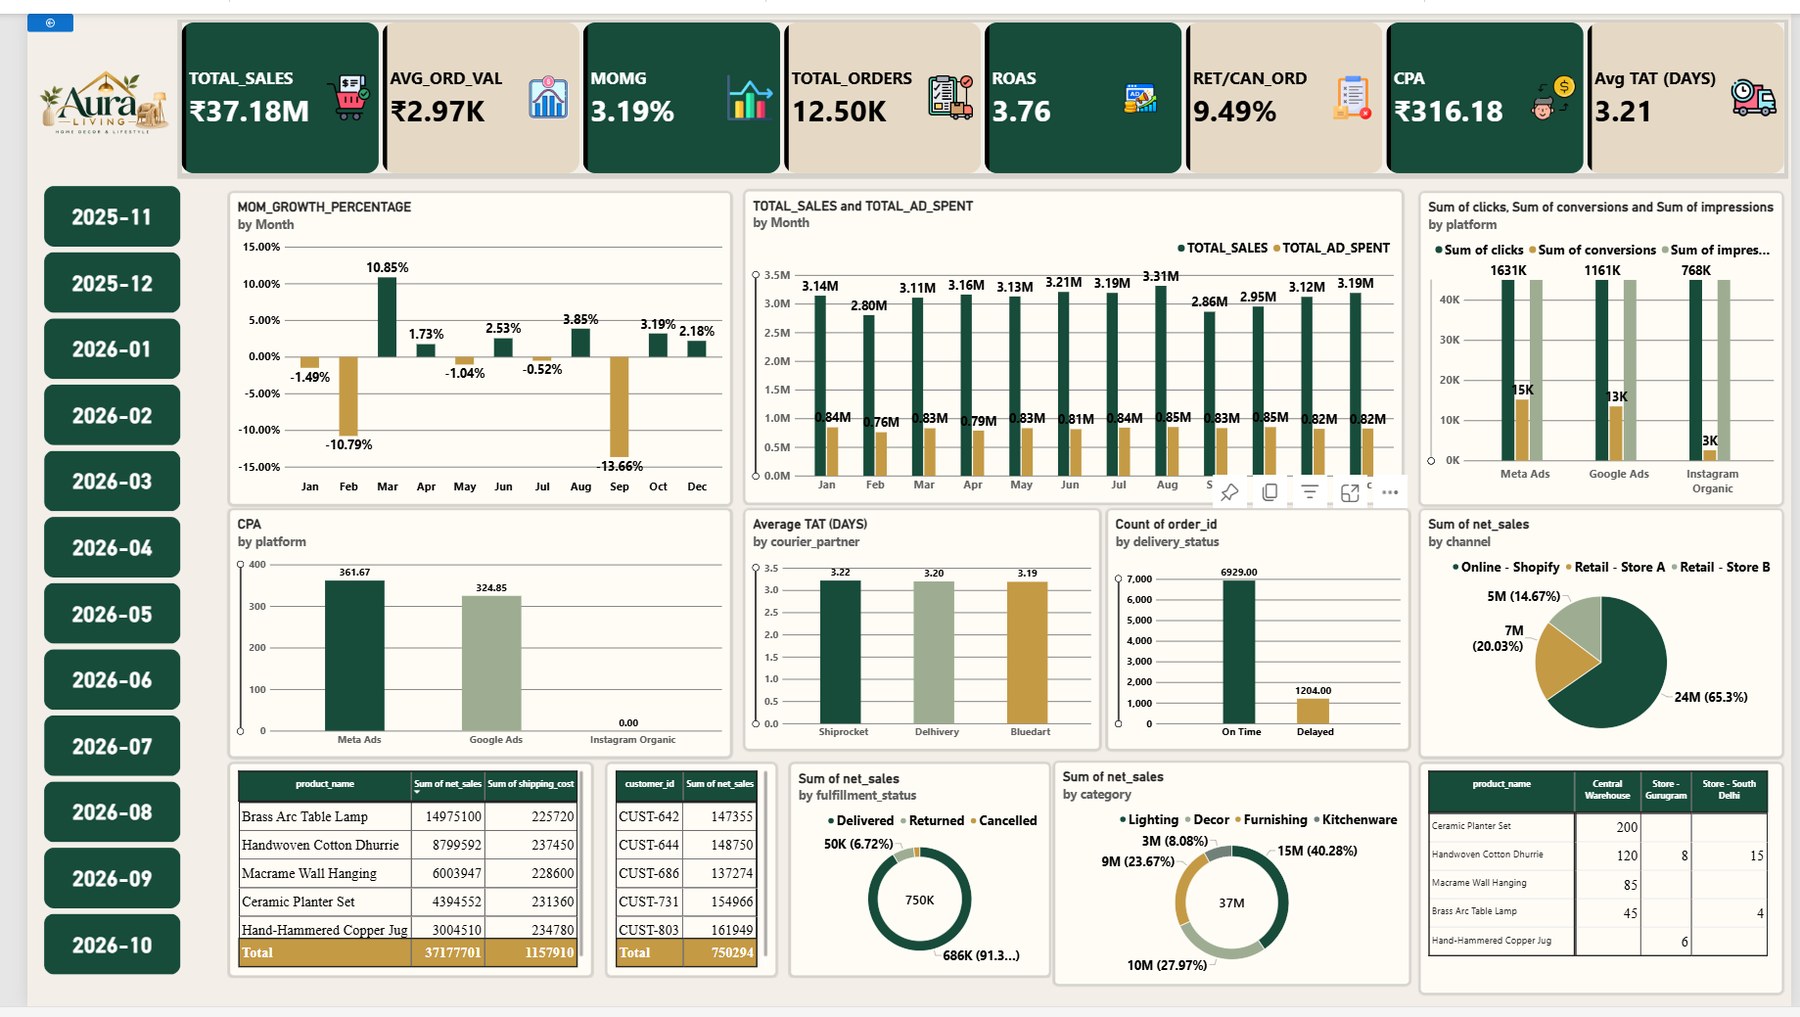 POWER BI DASHBOARD
A consolidated view of sales, marketing performance, order trends and delivery operations for a home décor and lifestyle retail business.
Financial performance · Accounts receivable · Cash flow & working capital
We discuss your goals, reporting needs and the questions you need answered.
I review, clean and organise your data so it is ready for reliable analysis.
I create clear reports or dashboards around the KPIs that matter to your business.
I walk you through the results, key findings and practical next steps.
I’m currently building my freelance client base. This section will feature genuine feedback from clients after completed projects. I don't publish made-up reviews.
Be my first client ↗Tell me what you’re trying to understand or improve. We can discuss your data, reporting needs and the right way to get started.